What the symbols, lines and figures mean on meteorological diagrams
THE AREA OF A DEPRESSION generally has a warm sector distinct from the remainder. The air in the warm sector is forced to climb up over the cold air in the rear of the depression. The warm air often climbs to a great height and forms heavy cumulo-nimbus clouds such as those seen in this picture.
METEOROLOGY may be defined as the study of the weather. It uses as its raw material the observations made at numerous stations distributed over a wide area. Each country has an official weather service, which maintains a number of stations, at each of which an observer notes several factors at certain standard times. These factors are: the pressure as shown by the barometer, the change of pressure in the preceding three hours, the wind velocity and direction, the temperature and humidity of the air, the state of the sky, the weather and the visibility.
Certain stations observe, in addition, the wind in the upper air, up to heights of 10,000 feet, or even higher. All the observations are sent to the headquarters office of the meteorological service in the form of groups of five figures, by telephone, telegraph or radio.
Fig. 1. CHART MARKINGS which denote the conditions at a meteorological observation station. The figures and lettering indicate barometric pressure, temperature and weather; the lines indicate wind speed and direction.
For the purpose of forecasting the weather, the observations are plotted on large-scale charts covering a considerably greater area than that for which it is required to forecast the weather. The mode of plotting is best shown by an example. A small dot on the chart indicates the position of the station. Against the dot (see Fig. 1) is written first the pressure in millibars (30 in. of mercury equal 1015·9 millibars), the initial 9 or 10 being omitted.
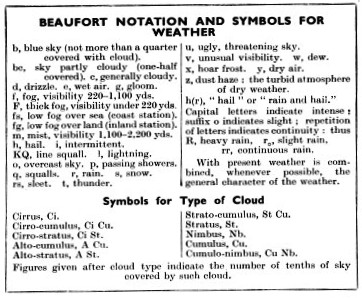
In the example shown, a pressure of 1014·7 is shown as 14·7. The -16 above it shows that the pressure has fallen sixteen-tenths of a millibar in the last three hours. Next are written the figures for temperature, in this instance 53°, and below these, letters showing the weather at the time; b c indicates sky half covered with cloud. The meaning of this and of cognate symbols is explained in the Table shown below. The direction of the wind is shown by an arrow ending at the position of the station, and the number of barbs on the arrow indicates the strength of the wind on the Beaufort Scale (see the Table shown left). In the example, the wind was south-west, force 4. In recent British weather reports the full-length barb indicates two steps on the Beaufort Scale, and a half-length barb a single step. Thus two and a half barbs would indicate force 5, which is a fresh breeze. In the charts shown in Figs. 2 and 3 each barb represents one step on the Beaufort Scale. If rain is falling at the time of observation the fact is shown by a black dot over the position of the station.
When the observations have been plotted in this way for all the stations, the forecaster draws on the chart a series of isobars, or lines along which the pressure is everywhere the same. The isobars are much like the contour lines on a survey map. The shapes of the isobars determine the general nature of the weather. When they form a series of closed curves enclosing the highest pressure at the centre, they indicate what is known as an anticyclone or high, and when they form a series of closed curves with the lowest pressure at the centre, they indicate what is variously known as a depression, cyclone, low or disturbance. Every chart covering a wide area will normally show these typical forms of isobars, with other forms which must occur in the intervening regions.
The first thing that strikes anyone examining a weather chart is that the winds blow round the isobars in such a direction as to have lower pressure to the left than to the right of an observer who faces downwind, though they blow across the isobars from high to low pressure, at an angle of 20-30°. At heights of 2,000-3,000 feet the wind blows along the direction of the isobars, and its speed can be estimated from the distance apart of the isobars; the speed is greatest where the isobars are most closely crowded together.
Fig. 2. ISOBARS are lines joining points where the barometric pressure is the same. When these lines form closed curves enclosing the highest pressure at the centre, they indicate an anticyclone, as shown here.
The anticyclone is normally a region of light or moderate winds and quiet conditions generally, though not necessarily of fine weather. In winter, in particular, the anticyclone may bring much cloud and fog. A typical anticyclone is shown in Fig. 2 (right), which represents the conditions on March 5, 1931, at 6 p.m. This particular anticyclone gave fair weather over a wide area.
Sometimes an anticyclone will stay over the same region for a week or more, but the greatest difficulty which it presents to the weather forecaster is that it may disappear suddenly and unexpectedly.
Features of a Depression
The depression is the really dynamic partner in the atmosphere, being normally a region of strong winds and of disturbed weather generally. It frequently moves with great rapidity across from west to east and, if not moving rapidly, tends to change its direction of motion, sometimes without any direct evidence of its future course appearing on the chart.
Fig. 3. SHOWS a depression, with the lowest pressure at the centre. The cloud symbols are explained in the Table above.
A specimen of a depression is shown in Fig. 3 (left), which represents conditions at 7 a.m. on October 22, 1932.
The most interesting feature in all depressions, apart from the way in which the winds blow round the isobars, counter-clockwise, is the distribution of temperature. It is possible in most depressions to draw through the centre a line which isolates a warm sector of the depression from the remainder. In the example shown in Fig. 3, this line is shown drawn, and it is easy to see that the temperatures within the sector enclosed by it are higher than those in the remaining part of the depression.
From this diagram or chart it is easy to imagine the depression as an area of conflict between two currents of different temperatures. The part of the line drawn forward from the centre is known as the warm front. With the passage of this line over any given place, the colder air in the forward part of the depression is replaced by warm air. The part of the line drawn from the centre to mark the rear of the warm sector is called the cold front. As this line passes over a given place, the warm air of the warm sector is replaced by the colder air in the rear. The two currents of air in the depression have originated in different latitudes,- the warm current coming from the tropics and the cold air from the Polar regions.
If we took a vertical section through the warm sector of the depression in Fig. 3, we should find the structure of the currents to be as shown in Fig. 4, the cold air lying as a wedge under the warm air. The warm air slides up the surface of the cold air in the wedge in advance of the warm front, and in so doing gives up most of its content of water vapour in the form of rain, which falls to the ground through the cold air.
Fig. 4. THE AIR CURRENTS which occur in the warm sector of a depression. This diagram shows a vertical section through the warm area. The cold air and warm air in a depression originate in different latitudes. The warm air comes from the tropics; the cold air from the Polar regions.
The cold air in the rear of the depression is in the form of a wedge with a nose raised above the ground, and the warm air, which is forced to climb up over the nose, often climbs up to great heights, forming a heavy cloud of the cumulo-nimbus type, such as is shown in the photograph at the top of this page. The rate at which this air rises is often considerable, and is much greater than the upward rate of flow of air along the upper surface of the cold air at the warm front.
The scheme of warm and cold currents shown in Fig. 4 explains why the rain in a depression is generally confined to two belts, one in advance of the warm front, having a width of up to 200 miles, and a narrower one behind the cold front. In the warm sector itself the rain is intermittent, or no rain at all falls.
In the warm sector of a depression the visibility is not as a rule good, and the clouds are mainly uniform sheet clouds, showing little or no definite structure. In the main body of the cold air in the depression the visibility is good, and the clouds are cumulus, or heap clouds, with blue sky between them.
Beaufort notation and symbols for weather.
Within the main body of either warm or cold current the wind is steady, and any rain which falls is of the nature of scattered showers or light drizzle. It is only near the boundary between cold and warm air that sudden changes of weather can occur. It is here that the heavy rain is found and that towering clouds can form.
The meteorologist bases his forecast of the weather largely on the scheme of currents and weather described above. By noting the distance which the depression has travelled since the last chart was drawn, he can estimate its position at any future time and, when the direction or speed of travel is changing, he generally has some indications of this shown on the chart.
Once the position of the depression at any future time has been fixed the winds can be foretold with fair accuracy from the fact that they blow round the depression in a counter-clockwise direction. Then the rainbelts travel with the depression while undergoing certain modifications which also can be foretold with reasonable accuracy. Thus it is possible to time the arrival of rain, the changes in type and height of cloud, the variations of wind, temperature and visibility, and the time of cessation of the rain, with sufficient accuracy to be of real use to the aviator.
It is frequently possible, merely from an examination of the weather chart, to choose the most suitable time for any operation so as to avoid rain or poor visibility. The worst enemies of all forms of transport are snow and fog, which can immobilize transport in less time than any other aspect of weather. Snow will fall instead of rain when the temperature at the ground is down to about freezing point or below it.
Certain factors are of the greatest importance to aviation. These are wind speed, direction and gustiness, weather, visibility and ice formation on aircraft.
With reference to the first of these factors, if a course is to be followed by navigation, a knowledge of the wind speed and direction is necessary.
Squally winds may be a danger to aircraft in the air, and can make landing hazardous.
In considering weather, the occurrence of rain is important mainly because of its influence on visibility. Snow has a similar effect, with the addition that snow lying on the ground increases the difficulties of landing. Thunderstorms are associated with upward currents which come in strong squalls, frequently with heavy falls of hail.
The height and amount of cloud have a twofold importance. When the sky is covered with cloud, the meteorologist cannot give a measurement of the wind velocity and direction; he has to estimate from his weather chart the state of the wind above the clouds. Accurate navigation is then impossible, or is possible only with the help of direction-finding wireless stations, and the pilot has to fly low to find his way. It is, therefore, of great importance that he should have an accurate idea of the height of the clouds.
The conditions which are most favourable to the formation of fog are the occurrence of light winds and clear sky in winter. The depth of dense fog formed in these conditions is often only a few hundred feet, and seldom exceeds 800 feet, the average being about 600 feet. Fog is formed also when warm, damp air flows over cold ground, as, for example, when over the British Isles a spell of cold weather breaks down with the coming of a warm, damp, south-westerly current from the Atlantic, in advance of a depression. Fog formed in this way is often persistent, sometimes lasting for more than twenty-four hours. Its coming can normally be foretold, but it is generally difficult to estimate beforehand how long it will last.
The rapid development of flying has only within the last few years brought to the front a problem which faces any aircraft which has to fly through cloud in winter. This problem is the formation of ice on the wings and propeller.
We are familiar with the fact that in normal conditions water freezes at a temperature of 32° Fahr., but in the atmosphere this does not generally happen when the water is in the form of small drops, as in a cloud. It has been found that clouds can be composed of liquid drops even at temperatures as low as -40° Fahr. But the drops of water at this low temperature are in an unstable condition, and tend to freeze immediately they come into contact with any solid surface. Water drops at temperatures below freezing point are said to be supercooled.
When ice is melted, a certain amount of heat has to be applied. Conversely when water freezes, an equivalent amount of heat is set free. When a drop of water at a temperature below freezing point is frozen, some heat is liberated. If a supercooled water-drop strikes against the leading edge of the wing of an aircraft, a part only of the water is frozen into ice which sticks to the wing, and the heat liberated is used in raising the temperature of the remainder of the water in the drop to the temperature of the freezing point. The remaining liquid water splashes over the wing, but soon freezes on contact with the cold air and the cold wing.
The deposit of ice on aircraft is small when the aircraft is flying through clouds at a temperature of more than about 10° Fahr. below freezing point, and is greatest in clouds whose temperatures are about 5° to 8° Fahr. below freezing point. The following is a brief summary of the conditions in which dangerous conditions are liable to occur.
At the warm front in a depression, the cloud is often of great thickness and, if the temperature within the dense part of the cloud is within the critical range, ice formation is likely to occur. It is generally possible to fly under the clouds at a warm front, but, if the surface temperature is only a few degrees above freezing point, flying through the cloud should always be avoided. Ice accretion does not always occur in these conditions, for some reason which is not fully understood, but the risk is always present. Should the temperature below the cloud sheet be below freezing point, while rain is falling from a higher level, there is a grave risk of the rain freezing into a heavy deposit on all parts of the structure.
At the cold front of' the depression, any level within the heavy cumulus clouds which are characteristic of this part of the depression, where the temperature is about 5 to 8° Fahr. below freezing point, will also be liable to give ice accretion, particularly when the clouds are dense.
In Great Britain ice accretion is commonest in strato-cumulus clouds in winter.


 n the example shown, a pressure of 1014·7 is shown as 14·7. The -
 r chart is that the winds blow round the isobars in such a direction as to have lower pressure to the left than to the right of an observer who faces downwind, though they blow across the isobars from high to low pressure, at an angle of 20-